

 Save
Save Print
Print

The 22nd China Ferro-alloys International Conference, host ed by Ferro-Alloys.com, will be held on 20 May to 22 May, 2026 in Beijing city, China. We sincerely invite you jointly explore the development ferroalloys trend in 2026. Why Attend?
[Ferro-Alloys.com] Eramet: structural measures to strengthen balance sheet and prepare the future
Christel Bories, Group Chair and CEO: In 2025, global macroeconomic headwinds and core commodities at cyclical lows combined with the weakening of the dollar weighed on the Group’s profitability and cash generation, while our operational performance did not meet our objectives across all operations.
However, we reached several key decisive milestones of our strategic roadmap, notably the ramp-up of our lithium production in Centenario. This is an achievement the Eramet team can be proud of, positioning our Group at the heart of the energy transition with a world-class asset. Our achievement in early 2026 of the IRMA 50 performance level by our mineral sands mine in Senegal also marks a major milestone in the Group’s Act for Positive Mining vision.
In 2026, our priority is to remain focused on improving our operational performance, controlling our costs and investments, with a particular attention to safety. The ReSolution programme provides a rigorous execution framework for these actions, leveraging our world-class assets.
We have also launched other structural actions, aimed at strengthening our balance sheet, with the full support of the Board of Directors, including a strategic review with asset monetisation options in 2026, as well as a planned equity base strengthening. During this transition, I know I can count on the commitment of all our teams.
- Key figures by activity
|
Millions of euros |
|
2025 |
2024 |
Chg. (€m) |
Chg.1 (%) |
|
|
Manganese |
Turnover |
1,843 |
2,025 |
-182 |
-9% |
|
|
|
EBITDA |
357 |
563 |
-206 |
-37% |
|
Manganese
EBITDA for the Manganese activity was €357m in 2025, (-37% vs. 2024):
Ore: EBITDA at €271m (-40%), impacted by declining average selling prices (-11%), rising costs and an unfavourable currency effect.
Alloys: EBITDA at €86m (-20%), penalised by declining selling prices (notably in the United States), a less favourable product mix and slightly increasing reductant costs. These im-pacts were partly offset by the one-off sale of CO2 quotas (+€46m) under the “Cash Boost” programme.
|
Manganese ore |
2025 |
2024 |
Chg. |
Chg. (%) |
|
Turnover - €m |
1,009 |
1,124 |
-115 |
-10% |
|
EBITDA - €m |
271 |
455 |
-184 |
-40% |
|
Manganese ore and sinter transportation - Mt |
6,148 |
6,115 |
+33 |
+1% |
|
External manganese ore sales - Mt |
5,489 |
5,481 |
+8 |
+0% |
|
FOB cash cost (new definition) - $/dmtu |
2.4 |
2.2 |
+0.2 |
+9% |
|
Manganese alloys |
2025 |
2024 |
Chg. |
Chg. (%) |
|
Turnover - €m |
834 |
901 |
-67 |
-7% |
|
EBITDA - €m |
86 |
108 |
-22 |
-20% |
|
Alloys sales - kt |
639 |
632 |
+7 |
+1% |
|
o/w refined alloys - % |
52 |
54 |
-2 |
-4% |
Market trends & prices
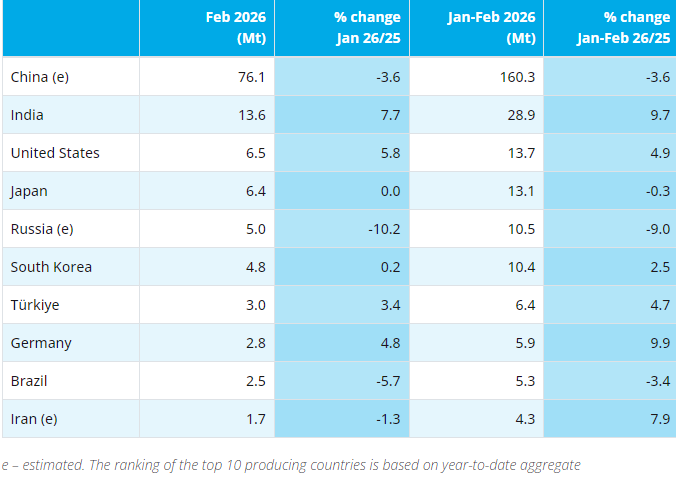
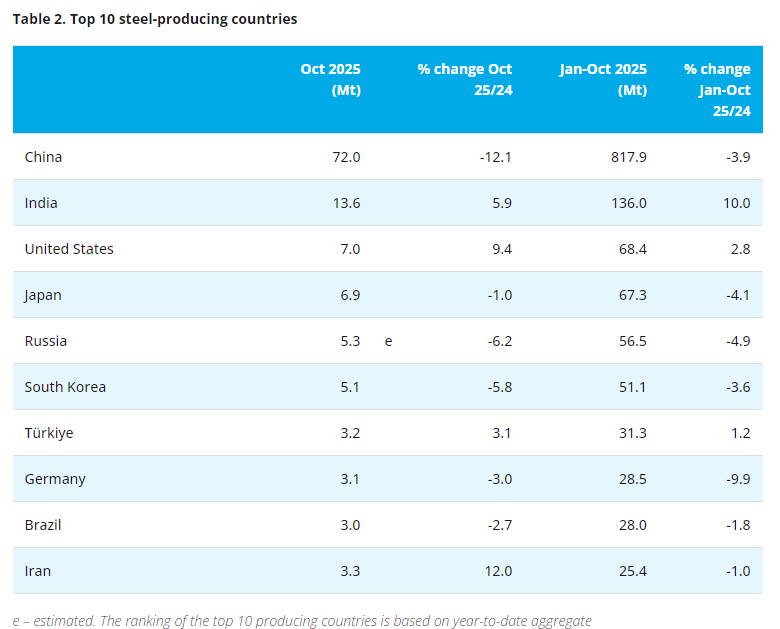
Global production of carbon steel, the main end-product for manganese, was 1,849 Mt in 2025, down 2% from 2024.
China, which accounts for more than half of global steel production, posted a year-on-year decline of 4%, ending at its lowest level since 2018. Conversely, India continued to see an increase in pro-duction (+10%), which was also the case in North America (+2%), benefitting from the protectionist measures introduced. Europe posted a further decline of 4%, faced with continued declining demand and continuing pressure from imports.
Manganese ore consumption for 2025 was up by 7% to reach 20.6 Mt-Mn, driven by demand for global manganese alloys production, particularly in China. However, with local steel production at its lowest level, this translated into higher levels of manganese alloy inventories among Chinese pro-ducers.
Manganese ore production increased to 20.8 Mt-Mn (+7%), strongly increasing in H2 (+12% vs. H1 2025). Production from South Africa (still accounting for nearly 50% of seaborne production) was significantly up over the year (+7%). In Gabon, volumes were stable over the year, in line with Comi-log volumes. In Australia, volumes, which increased sharply, normalised in H2 (x4 vs. H1 2025), following the resumption of exports by a major producer.
As a result, the manganese ore supply/demand balance was in slight surplus over the year. Chi-nese port ore inventories remained at 4.6 Mt at end-December (stable vs. end-September), equiva-lent to 8 weeks of consumption.
In 2025, the price index (CRU) for manganese ore (CIF China 44%) averaged $4.5/dmtu, down 18% from 2024. This trend reflects unfavourable comparatives, given the strong price increases between April and June 2024. Prices slightly rebounded in Q4 2025, rflecting stronger demand from manganese alloy production in China.
The price index (CRU) for refined alloys in Europe (MC Ferromanganese) declined by 10%, while the price index for standard alloys (Silicomanganese) was down by 8%. Nonetheless, manganese alloys prices in European markets rebounded in December following the formal adoption of safe-guard measures by the European Union.
Activities
In Gabon, the operational performance was heavily impacted in 2025 by logistics and operational challenges at the port of Owendo in H1 and on the rail network.
Against this backdrop, volumes for manganese ore transported and sold externally came out to 6.1 Mt and 5.5 Mt respectively, representing stable levels vs. 2024, a year marked by historically low volumes. Rail transport remains one of the main bottlenecks in the logistics chain, highlighting the strategic importance of the ongoing investment programme to renovate and modernise the Transgabonese railway.
In parallel, production at the Moanda mine was up 4% to 7.1 Mt.
FOB cash cost for manganese ore activity was $2.4/dmtu over the year (+9% vs. 2024). This in-crease mainly reflects rising production costs, notably linked to the heavier reliance on a local logis-tics partner, higher maintenance costs, as well as an unfavourable €/$ exchange rate. Mining taxes and royalties (paid to the Gabonese State) stood at $0.2/dmtu in 2025 (stable vs. 2024). Conversely, sea transport costs per tonne were down to $0.7/dmtu (-31%).
Manganese alloys production totalled 653 kt in 2025, up 3%, reflecting the restart of production at Dunkirk smelter following the refurbishment of the furnace. Manganese alloys sales slightly in-creased (+1%), albeit with a less favourable product mix (52% of refined alloys).
The manganese alloys margin considerably eroded over the year due to the significant decline in selling prices (particularly in the United States) and the increase in the cost of reductants, while the decline in the price of manganese ore consumed only provided marginal respite.
In July 2025, Norway’s Ministry for Climate and the Environment ruled in favour of Norwegian man-ganese alloys producers, including Eramet Norway, regarding unfair treatment in the allocation of free emission allowances under the EU ETS for the 2021-2025 period. Additional CO2 emission al-lowances were thus allocated to Eramet Norway for this period, enabling the one-off sale of allowances with a positive impact of €46m on alloys EBITDA in 2025, as part of the Cash Boost programme.
Outlook
Global carbon steel production is expected to moderately increase in 2026, with a less significant decline in Chinese production than in 2025, positively offset by an increase for the rest of the world – particularly in India where Eramet has a strong business footprint.
Demand for manganese ore should decline in 2026, with the robust Indian production not sufficient to offset an anticipated decrease in alloys production in China. Manganese ore supply is expected to increase with lower comparatives in 2025, during which a major producer only resumed exports in May.
The market consensus, which is currently set around $4.8/dmtu on average for 2026, with a lower H1 than H2, reflecting an increase of close to 6% in the manganese ore price index (CIF China 44%) compared with 2025.
Demand for alloys is expected to increase slightly outside of China, in line with the growth in steel production.
After a year disrupted by logistics challenges, transported manganese ore volumes are expected to be between 6.4 and 6.8 Mt in 2026. This increase will be delivered by ongoing railway renovation works and operational performance improvement actions spearheaded under the ReSolution pro-gramme. These actions serve to debottleneck transport capacity by optimising traffic, increasing the number of carriages per train and optimising maintenance. These initiatives will be supported by investments estimated at around €160m in 2026, of which around €70m related to logistics improve-ments.
FOB cash cost is expected between $2.4 and 2.6/dmtu in 2026, with the favourable effect of a volume increase largely offset by an unfavourable €/$ currency effect.
Following the announcement in 2025 by the Gabonese authorities of the intention to transform more ore locally, Eramet continues to conduct studies and discussions with the authorities regarding ore processing and value creation options in a robust win-win partnership approach. The objective is to swiftly establish a joint roadmap with the authorities that will enable value creation by contributing to Gabon’s industrial development as well as the viability of the associated economic ecosystem.
Manganese alloys sales are expected to remain stable over the year.
Outlook
At the start of 2026, the macroeconomic uncertainties that weighed on demand across our markets in 2025 are being mitigated by favourable pricing conditions, with the exception of mineral sands.
In China, exports are set to remain pivotal in supporting industrial activity to address the weak-ness in domestic consumption,
In the United States, growth should remain strong, driven by robust domestic consumption and moderately impacted by the tariff measures,
In Europe, despite successive interest rate cuts, the prospect of a rebound in 2026 appears limited,
In India, despite high US tariffs and a slight decline in public spending, demand remains brisk and could be bolstered in 2026 by the signing of trade agreements with the United States and Europe.
The price consensus and exchange rate for 2026 currently stand at:
c.$4.8/dmtu on average for manganese ore,
c.$15,750/t for LME nickel,
c.$15,700/t-LCE for lithium carbonate (battery-grade, CIF Asia),
1.20 for the EUR/USD exchange rate.
To reduce its foreign exchange risk exposure, the Group has implemented hedging on its EUR/USD exposure. This covers approximately two-thirds of its annual exposure and is in line with current Bloomberg consensus for 2026.
In 2026, manganese alloys selling prices are expected to face high volatility given the European Union's Safeguard measures and protectionist measures in the United States.
Domestic prices for nickel ore sold in Indonesia, which are indexed to the LME and change accord-ingly, should continue to benefit from increased premiums versus 2025, supported by the context tension on Indonesian ore supply.
Sensitivities of adjusted EBITDA (excl. SLN) to the price of metals and to the exchange rate are presented in Appendix 6.
In 2026, freight rates are expected to be at levels comparable to or slightly higher than those ob-served in 2025, fuelled by rising demand combined with limited growth in supply. Energy costs should decrease in 2026, while reductants should increase slightly.
Guidance
The ReSolution programme sets a framework aimed at delivering a run rate EBITDA improvement potential of €130-170m within two years (at 2025 economic conditions), with full impact expected in 2028. Most of this potential comes from the manganese ore activity, notably from expected volume growth. It does not include the lithium production ramp-up and does not cover Weda Bay.
2026 targets:
|
Activities |
|
Indicator |
2026 guidance |
|
Manganese |
|
Transported volumes |
6.4 - 6.8 Mt |
|
|
|
FOB cash cost Alloys sales |
$2.4 - $2.6/dmtu Stable vs. 2025 |
Appendix 1: Quarterly turnover
|
€ million |
Q4 2025 |
Q3 2025 |
Q2 2025 |
Q1 2025 |
Q4 2024 |
Q3 2024 |
Q2 2024 |
Q1 2024 |
|
Manganese |
474 |
421 |
492 |
457 |
460 |
569 |
548 |
448 |
|
Manganese ore activity |
264 |
221 |
275 |
250 |
224 |
338 |
308 |
254 |
|
Manganese alloys activity |
210 |
200 |
217 |
207 |
236 |
231 |
241 |
193 |
Appendix 2: Productions and shipments
|
|
|
H2 2025 |
Q4 2025 |
Q3 2025 |
H1 2025 |
Q2 2025 |
Q1 2025 |
FY 2025 |
FY 2024 |
|
Manganese |
|||||||||
|
Manganese ore and sinter production (Mt) |
|
3,554 |
1,680 |
1,874 |
3,549 |
1,764 |
1,785 |
7,103 |
6,803 |
|
Manganese ore and sinter transportation (Mt) |
|
3,103 |
1,517 |
1,586 |
3,045 |
1,659 |
1,386 |
6,148 |
6,115 |
|
External manganese ore sales (Mt) |
|
2,817 |
1,572 |
1,245 |
2,672 |
1,432 |
1,240 |
5,489 |
5,481 |
|
Manganese alloys production (kt) |
|
331 |
157 |
174 |
322 |
160 |
162 |
653 |
635 |
|
Manganese alloys sales (kt) |
|
329 |
174 |
156 |
310 |
161 |
149 |
639 |
632 |
Appendix 3: Price, index and exchange rate
|
|
Q4 2025 |
H2 2025 |
H1 2025 |
FY 2025 |
Q4 2024 |
H2 2024 |
H1 2024 |
FY 2024 |
Chg. H2 2025 – H1 2025 |
Chg. 2025 – 2024 |
|
Manganese |
|
|
|
|
|
|
|
|
|
|
|
Mn CIF China 44% ($/dmtu) |
4.53 |
4.43 |
4.64 |
4.54 |
4.08 |
5.68 |
5.38 |
5.53 |
-4% |
-18% |
|
Ferromanganese MC – Europe (€/t) |
1,330 |
1,333 |
1,460 |
1,397 |
1,499 |
1,597 |
1,523 |
1,560 |
-9% |
-10% |
|
Silicomanganese – Europe (€/t) |
1,014 |
1,020 |
1,078 |
1,049 |
1,000 |
1,113 |
1,171 |
1,142 |
-5% |
-8% |
Appendix 4: Performance indicators
|
Millions of euros |
|
2025 |
2024 |
Chg. (€m) |
Chg.2 (%) |
|
Manganese |
Turnover |
1,843 |
2,025 |
-182 |
-9% |
|
|
EBITDA |
357 |
563 |
-206 |
-37% |
|
|
FCF |
46 |
101 |
-55 |
-54% |
|
Manganese ore activity |
Turnover |
1,009 |
1,124 |
-115 |
-10% |
|
|
EBITDA |
271 |
455 |
-184 |
-40% |
|
|
FCF |
-27 |
94 |
-121 |
n.a. |
|
Manganese alloys activ- ity
|
Turnover |
834 |
901 |
-67 |
-7% |
|
|
EBITDA |
86 |
108 |
-22 |
-20% |
|
|
FCF |
73 |
7 |
+66 |
+943% |
- [Editor:tianyawei]
 Daily News
 Research
 Magazine
 Company Database
 Customized Database
 Conferences
 Advertisement
 Trade
Trade


 Online inquiry
 Contact


Tell Us What You Think