

 Save
Save Print
Print

The 22nd China Ferro-alloys International Conference, host ed by Ferro-Alloys.com, will be held on 20 May to 22 May, 2026 in Beijing city, China. We sincerely invite you jointly explore the development ferroalloys trend in 2026. Why Attend?
[Ferro-Alloys.com] December 2025 crude steel production and 2025 global crude steel production totals
World crude steel production for the 70 countries reporting to the World Steel Association (worldsteel) was 139.6 million tonnes (Mt) in December 2025, a 3.7% decrease compared to December 2024.
Crude steel production by region
Africa produced 1.9 Mt in December 2025, down 0.3% on December 2024. Asia and Oceania produced 99.7 Mt, down 6.3%. The EU (27) produced 9.9 Mt, up 3.9%. Europe, Other produced 3.8 Mt, up 13.8%. The Middle East produced 5.3 Mt, up 13.9%. North America produced 9.0 Mt, down 0.4%. Russia & other CIS + Ukraine produced 6.9 Mt, down 2.7%. South America produced 3.2 Mt, up 1.2%.
Table 1. Crude steel production by region
|
Dec 2025(Mt) |
% changeDec 25/24 |
Jan-Dec 2025(Mt) |
% changeJan-Dec 25/24 |
|
|---|---|---|---|---|
|
Africa |
1.9 |
-0.3 |
23.2 |
3.8 |
|
Asia and Oceania |
99.7 |
-6.3 |
1,324.5 |
-2.4 |
|
EU (27) |
9.9 |
3.9 |
126.2 |
-2.6 |
|
Europe, Other |
3.8 |
13.8 |
42.8 |
-0.9 |
|
Middle East |
5.3 |
13.9 |
56.9 |
4.3 |
|
North America |
9.0 |
-0.4 |
107.4 |
0.7 |
|
Russia & other CIS + Ukraine |
6.9 |
-2.7 |
81.3 |
-4.4 |
|
South America |
3.2 |
1.2 |
41.5 |
-1.2 |
|
Total 70 countries |
139.6 |
-3.7 |
1,803.8 |
-2.0 |
The 70 countries included in this table accounted for approximately 98% of total world crude steel production in 2024.
Regions and countries covered by the table:
- Africa: Algeria, Egypt, Libya, Morocco, South Africa, Tunisia
- Asia and Oceania: Australia, China, India, Japan, Mongolia, New Zealand, Pakistan, South Korea, Taiwan (China), Thailand, Viet Nam
- European Union (27): Austria, Belgium, Bulgaria, Croatia, Czechia, Finland, France, Germany, Greece, Italy, Luxembourg, Netherlands, Poland, Portugal, Romania, Slovakia, Slovenia, Spain, Sweden
- Europe, Other: Macedonia, Norway, Serbia, Türkiye, United Kingdom
- Middle East: Bahrain, Iran, Iraq, Jordan, Kuwait, Oman, Qatar, Saudi Arabia, United Arab Emirates, Yemen
- North America: Canada, Cuba, El Salvador, Guatemala, Mexico, United States
- Russia & other CIS + Ukraine: Belarus, Kazakhstan, Russia, Ukraine
- South America: Argentina, Brazil, Chile, Colombia, Ecuador, Paraguay, Peru, Uruguay, Venezuela
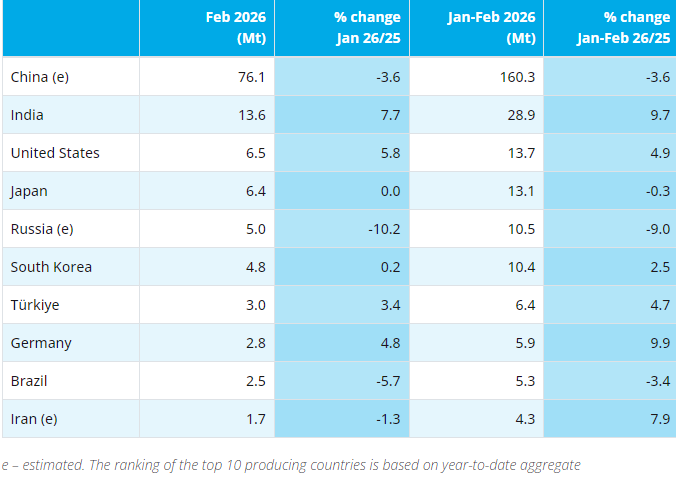
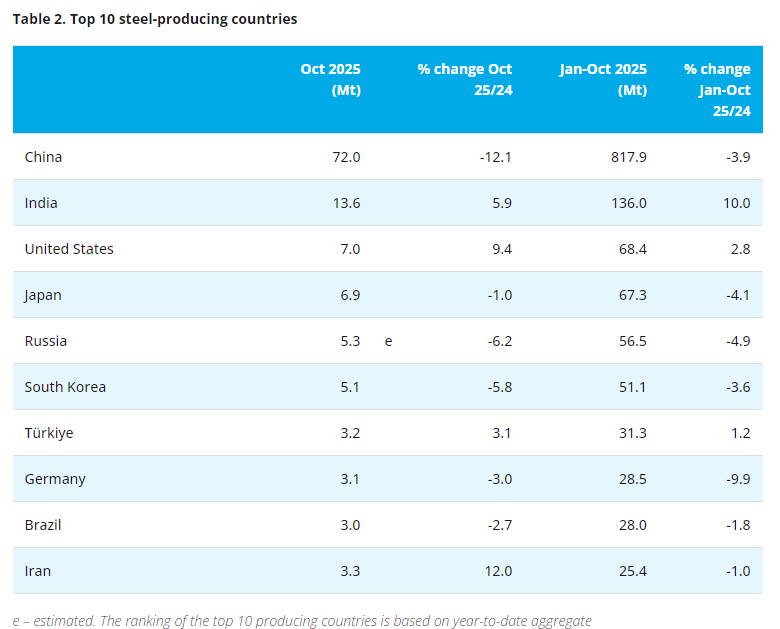
Top 10 steel-producing countries
China produced 68.2 Mt in December 2025, down 10.3% on December 2024. India produced 14.8 Mt, up 10.1%. The United States produced 6.9 Mt, up 3.6%. Japan produced 6.6 Mt, down 4.8%. Russia is estimated to have produced 5.8 Mt, down 4.4%. South Korea produced 5.2 Mt, down 2.4%. Türkiye produced 3.5 Mt, up 18.5%. Iran is estimated to have produced 3.0 Mt, up 16.2%. Germany produced 2.7 Mt, down 0.2%. Brazil produced 2.6 Mt, down 1.9%.
Table 2. Top 10 steel-producing countries
|
Dec 2025(Mt) |
% change Dec 25/24 |
Jan-Dec 2025(Mt) |
% changeJan-Dec 25/24 |
|
|---|---|---|---|---|
|
China |
68.2 |
-10.3 |
960.8 |
-4.4 |
|
India |
14.8 |
10.1 |
164.9 |
10.4 |
|
United States |
6.9 |
3.6 |
82.0 |
3.1 |
|
Japan |
6.6 |
-4.8 |
80.7 |
-4.0 |
|
Russia (e) |
5.8 |
-4.4 |
67.8 |
-4.5 |
|
South Korea |
5.2 |
-2.4 |
61.9 |
-2.8 |
|
Türkiye |
3.5 |
18.5 |
38.1 |
3.3 |
|
Germany |
2.7 |
-0.2 |
34.1 |
-8.6 |
|
Brazil |
2.6 |
-1.9 |
33.3 |
-1.6 |
|
Iran (e) |
3.0 |
16.2 |
31.8 |
1.4 |
e – estimated. The ranking of the top 10 producing countries is based on year-to-date aggregate
2025 global crude steel production totals
Total world crude steel production was 1,849.4 Mt in 2025. Please see the Steel Data Viewer for the complete listing of annual production totals by country.
Table 3: 2025 global crude steel production
|
Rank |
Country |
2025 |
2024 |
% change2025/2024 |
|---|---|---|---|---|
|
1 |
China |
960.8 |
1 005.1 |
-4.4 |
|
2 |
India |
164.9 |
149.4 |
10.4 |
|
3 |
United States |
82.0 |
79.5 |
3.1 |
|
4 |
Japan |
80.7 |
84.0 |
-4.0 |
|
5 |
Russia (e) |
67.8 |
71.0 |
-4.5 |
|
6 |
South Korea |
61.9 |
63.6 |
-2.8 |
|
7 |
Türkiye |
38.1 |
36.9 |
3.3 |
|
8 |
Germany |
34.1 |
37.3 |
-8.6 |
|
9 |
Brazil |
33.3 |
33.9 |
-1.6 |
|
10 |
Iran (e) |
31.8 |
31.4 |
1.4 |
|
11 |
Viet Nam |
24.7 |
22.0 |
12.2 |
|
12 |
Italy |
20.7 |
20.0 |
3.6 |
|
13 |
Indonesia (e) |
19.0 |
18.6 |
1.9 |
|
14 |
Taiwan, China (e) |
17.1 |
19.2 |
-10.8 |
|
15 |
Mexico (e) |
13.5 |
14.3 |
-5.9 |
|
16 |
Spain (e) |
12.0 |
11.9 |
0.7 |
|
17 |
Canada (e) |
11.5 |
12.3 |
-7.2 |
|
18 |
Saudi Arabia |
10.8 |
9.6 |
12.3 |
|
19 |
Egypt |
10.6 |
10.7 |
-0.8 |
|
20 |
France (e) |
9.8 |
10.8 |
-8.7 |
|
21 |
Malaysia (e) |
9.0 |
9.0 |
-0.2 |
|
22 |
Austria |
7.6 |
7.1 |
5.9 |
|
23 |
Ukraine |
7.4 |
7.6 |
-2.2 |
|
24 |
Poland (e) |
7.2 |
7.1 |
0.8 |
|
25 |
Belgium (e) |
7.2 |
7.1 |
0.5 |
|
26 |
Netherlands |
6.5 |
6.4 |
1.4 |
|
27 |
Algeria (e) |
5.3 |
4.5 |
17.9 |
|
28 |
Australia |
5.2 |
4.7 |
12.1 |
|
29 |
Thailand (e) |
5.0 |
4.9 |
2.6 |
|
30 |
Bangladesh (e) |
4.5 |
4.5 |
0.0 |
|
31 |
South Africa |
4.5 |
4.7 |
-4.7 |
|
32 |
Kazakhstan |
4.3 |
4.2 |
2.2 |
|
33 |
Argentina |
4.0 |
3.9 |
4.2 |
|
34 |
Sweden |
4.0 |
4.0 |
-0.7 |
|
35 |
United Arab Emirates |
3.8 |
3.7 |
3.3 |
|
36 |
Finland |
3.7 |
3.7 |
2.1 |
|
37 |
Slovakia (e) |
3.7 |
3.9 |
-5.6 |
|
38 |
Pakistan (e) |
3.6 |
4.1 |
-12.2 |
|
39 |
Iraq (e) |
3.0 |
3.0 |
0.3 |
|
40 |
Oman (e) |
3.0 |
3.0 |
0.0 |
|
Others |
41.8 |
44.1 |
-5.3 |
|
|
|
World |
1 849.4 |
1 886.8 |
- 2.0 |
e – annual figure estimated using partial data or non-worldsteel resources.
* The world total production figure in this table includes estimates of other countries that only report annually.
- [Editor:tianyawei]
 Daily News
 Research
 Magazine
 Company Database
 Customized Database
 Conferences
 Advertisement
 Trade
Trade


 Online inquiry
 Contact


Tell Us What You Think