

 Save
Save Print
Print【Ferro-alloys.com】December 2021 crude steel production
World crude steel production for the 64 countries reporting to the World Steel Association (worldsteel) was 158.7 million tonnes (Mt) in December 2021, a 3.0% decrease compared to December 2020.
Crude steel production by region
Africa produced 1.2 Mt in December 2021, down 9.6% on December 2020. Asia and Oceania produced 116.1 Mt, down 4.4%. The CIS produced 8.9 Mt, down 3.0%. The EU (27) produced 11.1 Mt, down 1.4%. Europe, Other produced 4.3 Mt, down 0.8%. The Middle East produced 3.9 Mt, up 22.1%. North America produced 9.7 Mt, up 7.5%. South America produced 3.5 Mt, down 8.7%.
| Table 1. Crude steel production by region | ||||||||
| Dec 2021 (Mt) | % change Dec 21/20 | Jan-Dec 2021 (Mt) | % change Jan-Dec 21/20 | |||||
| Africa | 1.2 | -9.6 | 16.0 | 26.7 | ||||
| Asia and Oceania | 116.1 | -4.4 | 1,382.0 | 0.6 | ||||
| CIS | 8.9 | -3.0 | 105.6 | 5.6 | ||||
| EU (27) | 11.1 | -1.4 | 152.5 | 15.4 | ||||
| Europe, Other | 4.3 | -0.8 | 51.2 | 11.6 | ||||
| Middle East | 3.9 | 22.1 | 41.2 | 1.2 | ||||
| North America | 9.7 | 7.5 | 117.8 | 16.6 | ||||
| South America | 3.5 | -8.7 | 45.6 | 17.8 | ||||
| Total 64 countries | 158.7 | -3.0 | 1,911.9 | 3.6 | ||||
The 64 countries included in this table accounted for approximately 98% of total world crude steel production in 2020. Regions and countries covered by the table:
- Africa: Egypt, Libya, South Africa
- Asia and Oceania: Australia, China, India, Japan, New Zealand, Pakistan, South Korea, Taiwan (China), Vietnam
- CIS: Belarus, Kazakhstan, Moldova, Russia, Ukraine, Uzbekistan
- European Union (27)
- Europe, Other: Bosnia-Herzegovina, Macedonia, Norway, Serbia, Turkey, United Kingdom
- Middle East: Iran, Qatar, Saudi Arabia, United Arab Emirates
- North America: Canada, Cuba, El Salvador, Guatemala, Mexico, United States
- South America: Argentina, Brazil, Chile, Colombia, Ecuador, Paraguay, Peru, Uruguay, Venezuela
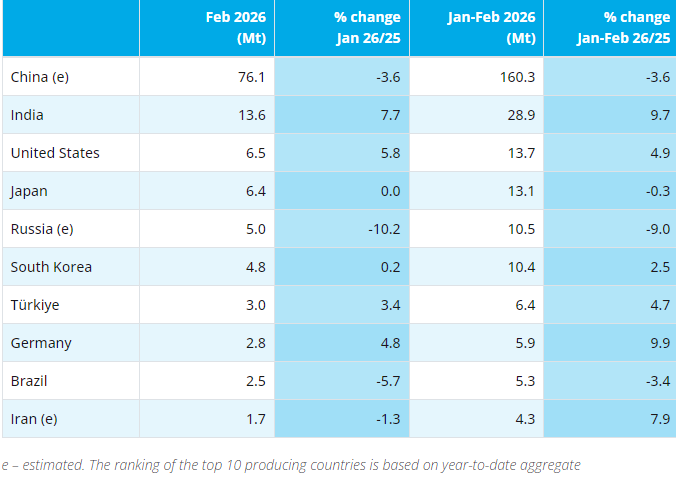
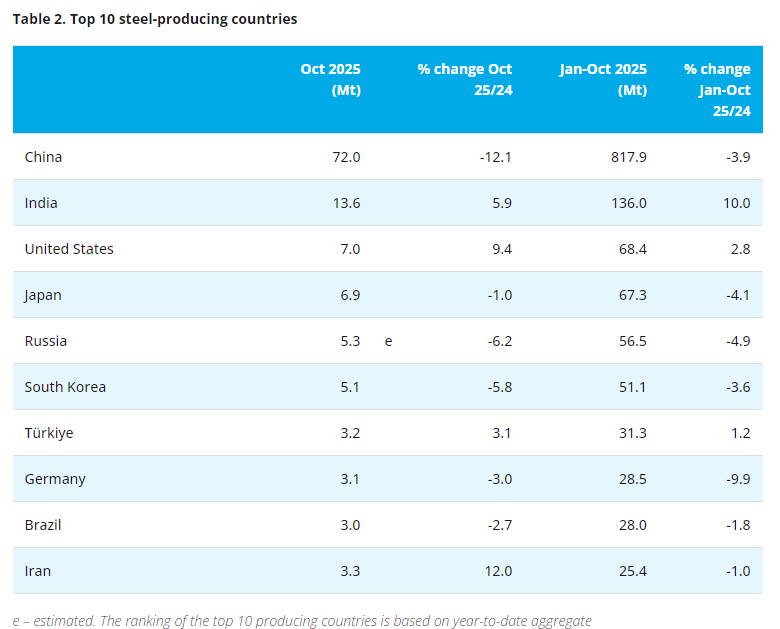
Top 10 steel-producing countries
China produced 86.2 Mt in December 2021, down 6.8% on December 2020. India produced 10.4 Mt, up 0.9%. Japan produced 7.9 Mt, up 5.4%. The United States produced 7.2 Mt, up 11.9%. Russia is estimated to have produced 6.6 Mt, the same as in December 2020. South Korea produced 6.0 Mt, up 1.1%. Germany produced 3.1 Mt, up 0.1%. Turkey produced 3.3 Mt, down 2.3%. Brazil produced 2.6 Mt, down 11.4%. Iran is estimated to have produced 2.8 Mt, up 15.1%.
| Table 2. Top 10 steel-producing countries | ||||||
| Dec 2021 (Mt) | % change Dec 21/20 | Jan-Dec 2021 (Mt) | % change Jan-Dec 21/20 | |||
| China | 86.2 | -6.8 | 1,032.8 | -3.0 | ||
| India | 10.4 | 0.9 | 118.1 | 17.8 | ||
| Japan | 7.9 | 5.4 | 96.3 | 14.9 | ||
| United States | 7.2 | 11.9 | 86.0 | 18.3 | ||
| Russia | 6.6 | e | 0.0 | 76.0 | 6.1 | |
| South Korea | 6.0 | 1.1 | 70.6 | 5.2 | ||
| Turkey | 3.3 | -2.3 | 40.4 | 12.7 | ||
| Germany | 3.1 | 0.1 | 40.1 | 12.3 | ||
| Brazil | 2.6 | -11.4 | 36.0 | 14.7 | ||
| Iran | 2.8 | e | 15.1 | 28.5 | -1.8 | |
2021 global crude steel production totals
Total world crude steel production was 1,950.5 Mt in 2021, a 3.7% increase compared to 2020. Please see the Steel Data Viewer for the complete listing of annual production totals by country.
| Rank | 2021 | 2020 | %2021/2020 | |
|---|---|---|---|---|
| 1 | China | 1 032.8 | 1 064.7 | -3 |
| 2 | India | 118.1 | 100.3 | 17.8 |
| 3 | Japan | 96.3 | 83.2 | 15.8 |
| 4 | United States | 86 | 72.7 | 18.3 |
| 5 | Russia (e) | 76 | 71.6 | 6.1 |
| 6 | South Korea | 70.6 | 67.1 | 5.2 |
| 7 | Turkey | 40.4 | 35.8 | 12.7 |
| 8 | Germany | 40.1 | 35.7 | 12.3 |
| 9 | Brazil | 36 | 31.4 | 14.7 |
| 10 | Iran (e) | 28.5 | 29 | -1.8 |
| 11 | Italy | 24.4 | 20.4 | 19.7 |
| 12 | Viet Nam (e) | 23.6 | 19.9 | 18.4 |
| 13 | Taiwan, China (e) | 23.3 | 21 | 10.9 |
| 14 | Ukraine | 21.4 | 20.6 | 3.6 |
| 15 | Mexico (e) | 18.4 | 16.8 | 9.5 |
| 16 | Spain | 14 | 11 | 27.7 |
| 17 | France | 13.9 | 11.6 | 20.3 |
| 18 | Canada (e) | 12.8 | 11 | 16.2 |
| 19 | Indonesia (e) | 12.5 | 12.9 | -2.9 |
| 20 | Egypt | 10.3 | 8.2 | 25.1 |
| 21 | Saudi Arabia | 8.7 | 7.8 | 12.3 |
| 22 | Poland (e) | 8.4 | 7.9 | 6.5 |
| 23 | Austria (e) | 7.9 | 6.8 | 17.1 |
| 24 | United Kingdom (e) | 7.4 | 7.1 | 3.9 |
| 25 | Belgium (e) | 7 | 6.1 | 13.6 |
| 26 | Netherlands | 6.6 | 6.1 | 9.4 |
| 27 | Malaysia (e) | 6.5 | 6.6 | -1.8 |
| 28 | Australia | 5.8 | 5.5 | 6 |
| 29 | Thailand (e) | 5.6 | 4.5 | 25.8 |
| 30 | Bangladesh (e) | 5.5 | 5.5 | 0 |
| 31 | Pakistan (e) | 5.3 | 3.8 | 39.9 |
| 32 | South Africa (e) | 5 | 3.9 | 29.5 |
| 33 | Argentina | 4.9 | 3.7 | 33.5 |
| 34 | Slovakia | 4.9 | 3.4 | 41.2 |
| 35 | Czechia | 4.8 | 4.5 | 7.9 |
| 36 | Sweden | 4.7 | 4.4 | 6.1 |
| 37 | Kazakhstan (e) | 4.4 | 3.9 | 12.5 |
| 38 | Finland | 4.3 | 3.5 | 24.1 |
| 39 | Algeria (e) | 4 | 4 | 0 |
| 40 | Romania (e) | 3.4 | 2.8 | 21.8 |
| Others | 36.2 | 34 | 6.4 | |
| World | 1 950.5 | 1 880.4 | 3.7 |
Source:Worldsteel

- [Editor:zhaozihao]
 Daily News
 Research
 Magazine
 Company Database
 Customized Database
 Conferences
 Advertisement
 Trade
Trade


 Online inquiry
 Contact


Tell Us What You Think