

 Save
Save Print
Print[Ferro-Alloys.com] ERAMET: Manganese Operational in H1 2025
- Eramet group key figures
|
Millions of euros1 |
H1 2025 |
H1 2024 |
Chg. (€m) |
Chg.1 (%) |
|
Adjusted turnover (excluding SLN)2 |
1,528 |
1,640 |
-112 |
-7% |
|
Turnover |
1,404 |
1,452 |
-48 |
-3% |
|
Adjusted EBITDA (excluding SLN)2 |
191 |
345 |
-154 |
-45% |
|
EBITDA |
71 |
102 |
-31 |
-30% |
|
Current Operating Income (excluding SLN) |
9 |
88 |
-79 |
-90% |
|
Net Income, Group share |
-152 |
-41 |
-111 |
n.a. |
|
Net Income, Group share (excluding SLN) |
-101 |
31 |
-132 |
n.a. |
As of 30 June 2025, Eramet’s liquidity, including undrawn credit lines, remains high at €1.7bn.
- Key figures by activity10
|
Millions of euros |
|
H1 2025 |
H1 2024 |
Chg. |
Chg.1 |
|
Manganese |
Turnover |
949 |
996 |
-47 |
-5% |
|
EBITDA |
197 |
225 |
-28 |
-12% |
Manganese
In H1 2025, EBITDA for the Manganese activity was €197m, down 12% year-on-year.
- Ore: EBITDA at €175m (-6%), impacted by the decline in volumes sold (-8%) while average realised selling prices remained almost stable (-1% vs. H1 2024, aligned to the CIF China 44% index with a 1-month lag and restated for currency effects)
- Alloys: EBITDA at €22m (-44%), reflecting the decrease in volumes sold (-4%) with a less favourable mix, combined with a significant increase in the cost of consumed ore (+20%).
|
Manganese ore |
H1 2025 |
H1 2024 |
Chg. |
Chg. (%) |
|
Turnover - €m |
525 |
562 |
-37 |
-7% |
|
EBITDA - €m |
175 |
186 |
-11 |
-6% |
|
Manganese ore and sinter transportation - Mt |
3.0 |
3.2 |
-0.2 |
-5% |
|
External manganese ore sales - Mt |
2.7 |
2.9 |
-0.2 |
-8% |
|
FOB cash cost (new definition) - $/dmtu |
2.3 |
2.0 |
+0.3 |
+14% |
|
Manganese alloys |
H1 2025 |
H1 2024 |
Chg. |
Chg. (%) |
|
Turnover - €m |
424 |
434 |
-10 |
-2% |
|
EBITDA - €m |
22 |
39 |
-17 |
-44% |
|
Alloys sales - kt |
310 |
322 |
-12 |
-4% |
|
o/w refined alloys - % |
50% |
54% |
-4 pts |
-7% |
Market trends & prices
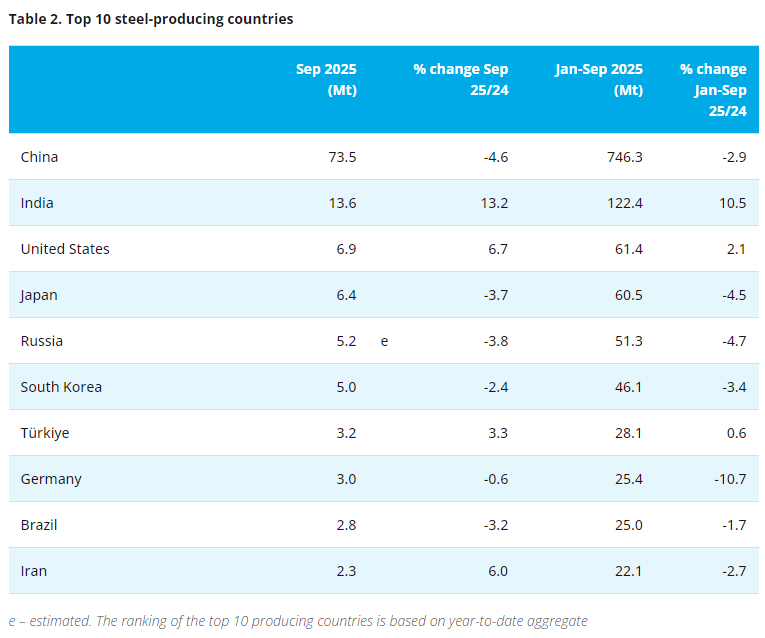
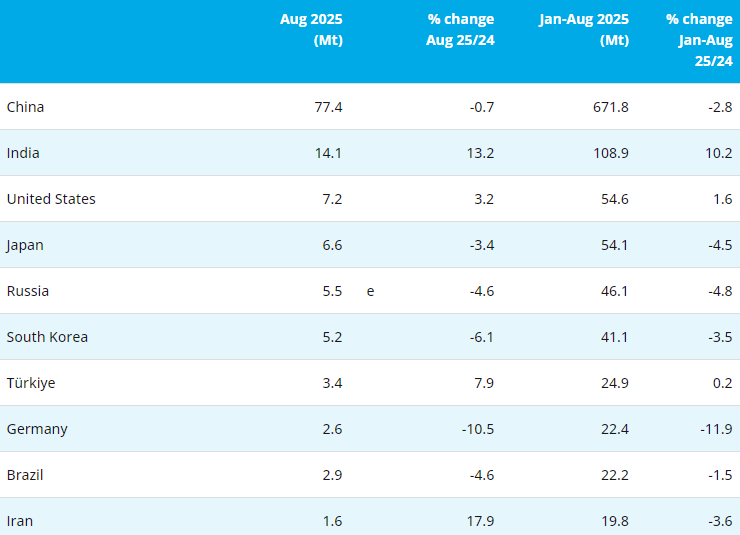
In H1 2025, global production of carbon steel, the main end-product for manganese, declined by nearly 2% to 958 Mt.
China, which accounts for half of global steel production, posted a decline of around 3% from H1 2024, in response to still declining domestic demand and despite continued rising steel exports. Production in India (+8%) and North America (+2%) increased, partly sustained by the announced protectionist measures, while Europe reported a decline (-2%) with demand still subdued, in an uncertain macroeconomic situation and faced with the continuing pressure of competitively priced imports.
Manganese ore consumption for H1 2025 increased to reach 9.9 Mt-Mn (+4%), mainly driven by demand for manganese alloys production (nearly 90% of total consumption). Chinese producers’ manganese alloys inventories increased over the first half, with the local backdrop of declining steel production.
Manganese ore production was up to 10.1 Mt-Mn (+6%), with a strong increase in Q2 (+13% vs. Q1 2025). Production from South Africa was brisk in Q2 (record month in April), benefitting from low sea freight rates and a depreciating ZAR. In Australia, a major producer (shut down since March 2024) resumed exporting in June 2025. As a result, ore volumes from South Africa and Gabon increased by 10% and 7% respectively over the first half, while Australian volumes declined by 40% compared to H1 2024.
The supply/demand balance was in surplus in H1 2025. After reaching a low level in Q1, Chinese port ore inventories totalled 4.5 Mt at end-June (vs. 3.7 Mt at end-March), equivalent to around 9 weeks of consumption.
In H1 2025, the price index (CRU) for manganese ore (CIF China 44%) averaged $4.6/dmtu (-14% vs. H1 2024). This trend reflects unfavourable comparatives, given the significant rise in prices between April and June 2024, peaking at $9/dmtu. In Q2, prices came under pressure, due to increased South African volumes and rising exports from Australia starting in May.
The price index (CRU) for refined alloys in Europe (MC Ferromanganese) decreased by 4% vs. H1 2024, showing greater resilience compared to the price index for standard alloys (Silicomanganese), which was down by 8%. This decline accelerated at the end of the first half, with indirect support from potential EU Safeguard Measures for ferroalloys waning over Q2.
Activities
In Gabon, after significantly constraining ore shipments and sales in Q1, the logistics challenges faced at the port of Owendo since end-2024 consistently improved in Q2. As a result, ore volumes sold externally increased by 15% in Q2 compared to Q1, reaching 2.7 Mt in H1 2025 (-8% vs. H1 2024).
Mine production stood at 3.5 Mt in H1 2025 (+1%), while transported volumes declined to 3.0 Mt (-5%), albeit significantly improving in Q2 (+20% vs. Q1, posting 600 kt in June). Rail transport remains the main pressure point in the logistics chain, highlighting the importance of the ongoing programme to renovate and modernise the Transgabonese railway.
FOB cash cost3 for manganese ore activity was $2.3/dmtu over the first half (+14% vs. H1 2024), mainly reflecting the decrease in volumes sold coupled with rising costs (primarily due to the equipment repair and maintenance expenses given the logistics challenges over the period). Mining taxes and royalties (paid to the Gabonese State) came out to $0.2/dmtu in H1 2025 (stable vs. H1 2024). Conversely, sea transport costs per tonne were down to $0.8/dmtu (-18%).
For H1 2025, manganese alloys production totalled 322 kt, slightly down (-1%), notably reflecting an adjustment to unfavourable market conditions. Manganese alloys sales were also down (-4%), with a less favourable product mix (50% refined alloys).
The manganese alloys margin considerably eroded over the half year, mainly factoring in the rising average cost of ore consumed by the plants (nearly +20%11). Other costs remained stable.
Outlook
Global carbon steel production is expected to decline in H2 vs. H1, in line with traditional seasonality and weaker demand. The continued decrease in Chinese production should be partly offset by an increase for the rest of the world, particularly in India. Eramet has a strong business footprint in India, which is expected to continue posting a significant increase in its steel production thanks to new installed capacity, infrastructure investments from the State and continued growth in demand from other steel-consuming sectors. Ore supply should increase in H2, driven by the full return to the market of the leading Australian producer, partly offset by a potential downward revision of South African exports.
Market consensus is currently set around $4.6/dmtu14 on average for H2 2025 but this appears directionally optimistic given the current level of the CIF China 44% index ($4.2/dmtu) and supply availability.
Demand for manganese alloys should decline in H2, in line with steel production, while supply is expected to remain stable. However, product flows could continue to be disrupted by uncertainty surrounding protectionist measures (particularly in Europe and the United States). Alloys selling prices are expected to decline in H2 vs. H1.
Considering the logistics challenges faced in H1, the target for transported manganese ore volumes is adjusted to between 6.5 Mt and 7.0 Mt in 2025. The targeted FOB cash cost3, confirmed at constant exchange rates15, is revised upwards to between $2.1 and $2.3/dmtu, to reflect the unfavourable trends in the consensus for the €/$ exchange rate.
Investments, primarily focusing on sustaining and strengthening the rail transportation capacity, are still estimated at around €130m in 2025.
Following the end-May announcement of a crude manganese export ban starting in 2029, Eramet has initiated discussions with the Gabonese government in an effort to review ore transformation and development options that could be co-created together, in a spirit of constructive cooperation and mutual respect aimed at building a partnership based on shared interests.
- Outlook
Uncertainty persists across all markets driven by the introduction of US tariffs. In H1, domestic demand in China was supported by stimulus programs and a surge in exports ahead of expected new tariff measures. However, the outlook remains uncertain for H2. This unstable macroeconomic environment should maintain a downward pressure on demand across the Group’s various end-markets.
The price consensus30 and exchange rate31 for H2 2025 currently stand at:
- c.$4.6/dmtu on average for manganese ore (as well as for the year 2025), which seems optimistic given the current level of the CIF China 44% index,
Manganese alloys selling prices are expected to decline in H2 2025. However, protectionist measures under consideration from the United States and the European Union could generate volatility in different regions of the world. Domestic prices for nickel ore sold in Indonesia are indexed to the LME and change accordingly. They should continue to benefit from significant ore price premiums on the HPM index in H2 2025, driven by local market factors at Halmahera.
Sensitivities of adjusted EBITDA (excl. SLN) to the price of metals and to the exchange rate are presented in Appendix 6.
Freight rates, which surged significantly at the start of Q3 owing to a tight supply of vessels, could still be higher in H2 2025 compared to H1. However, the outlook remains uncertain, primarily due to ongoing trade negotiations and geopolitical tensions in the Middle East. Energy costs should decrease slightly in H2 2025.
- Guidance
Against this backdrop, 2025 volume and cash cost targets have been adjusted as follows:
|
Activities |
Indicator |
2025 guidance |
2025 guidance |
|
Manganese ore |
Transported volumes |
6.7 - 7.2 Mt |
6.5 - 7.0 Mt |
|
Cash cost FOB |
$2.0 - $2.2/dmtu |
$2.1 - $2.3/dmtu |
Capex5 remains estimated between €400 and €450m in 2025.
|
Capex |
Activities |
2025 guidance |
2025 guidance |
|
Sustaining |
Group |
€150 - €200m |
Confirmed |
|
Growth |
Group, o/w: |
c.€250m |
Confirmed |
|
Manganese |
c.€130m |
Confirmed |
|
|
Mineral sands |
c.€50m |
Confirmed |
|
|
Lithium |
c.€60m |
c.€90m |
Appendix 2: Quarterly turnover
|
Millions of euros1 |
Q2 2025 |
Q1 2025 |
Q4 2024 |
Q3 2024 |
Q2 2024 |
Q1 2024 |
|
Manganese |
492 |
457 |
460 |
569 |
548 |
448 |
|
Manganese ore activity |
275 |
250 |
224 |
338 |
308 |
254 |
|
Manganese alloys activity |
217 |
207 |
236 |
231 |
241 |
193 |
Appendix 3: Productions and shipments
|
|
Q2 |
Q1 |
Q4 2024 |
Q3 2024 |
Q2 2024 |
Q1 2024 |
H1 2025 |
H1 2024 |
|
Manganese |
|
|
|
|
|
|
|
|
|
Manganese ore and sinter production (Mt) |
1,764 |
1,785 |
1,237 |
2,045 |
1,595 |
1,926 |
3,549 |
3,521 |
|
Manganese ore and sinter transportation (Mt) |
1,659 |
1,386 |
1,099 |
1,819 |
1,559 |
1,638 |
3,045 |
3,197 |
|
External manganese ore sales (Mt) |
1,432 |
1,240 |
1,418 |
1,152 |
1,445 |
1,466 |
2,672 |
2,911 |
|
Manganese alloys production (kt) |
160 |
162 |
145 |
166 |
170 |
154 |
322 |
324 |
|
Manganese alloys sales (kt) |
161 |
149 |
167 |
143 |
173 |
149 |
310 |
322 |
Appendix 4: Price, index and exchange rate
|
|
H1 2025 |
H1 2024 |
H2 2024 |
Chg. H1 2025 – H1 2024 |
Chg. H1 2025 – H2 2024 |
|
Manganese |
|
|
|
|
|
|
Mn CIF China 44% ($/dmtu)1 |
4.64 |
5.38 |
5.68 |
-14% |
-18% |
|
Ferromanganese MC – Europe (€/t)1 |
1,460 |
1,523 |
1,597 |
-4% |
-9% |
|
Silicomanganese – Europe (€/t)1 |
1,078 |
1,171 |
1,113 |
-8% |
-3% |
Appendix 5: Performance indicators
|
Millions of euros1 |
|
H1 2025 |
H1 2024 |
Chg. (€m) |
Chg.2 (%) |
|
Manganese |
Turnover |
949 |
996 |
-47 |
-5% |
|
|
EBITDA |
197 |
225 |
-28 |
-12% |
|
|
FCF |
45 |
3 |
+42 |
n.a. |
|
Manganese ore activity |
Turnover |
525 |
562 |
-37 |
-7% |
|
|
EBITDA |
175 |
186 |
-11 |
-6% |
|
|
FCF |
-14 |
-29 |
+15 |
n.a. |
|
Manganese alloys activity |
Turnover |
424 |
434 |
-10 |
-2% |
|
|
EBITDA |
22 |
39 |
-17 |
-44% |
|
|
FCF |
59 |
32 |
+27 |
+84% |
Appendix 6: Sensitivities of Group adjusted EBITDA (excluding SLN)
|
Sensitivities |
Change |
Adjusted EBITDA impact (excl. SLN) |
|
Manganese ore prices |
+$1/dmtu |
c. €230m |
|
Manganese alloys prices |
+$100/t |
c. €60m |
- [Editor:tianyawei]
 Daily News
 Research
 Magazine
 Company Database
 Customized Database
 Conferences
 Advertisement
 Trade
Trade


 Online inquiry
 Contact

Tell Us What You Think