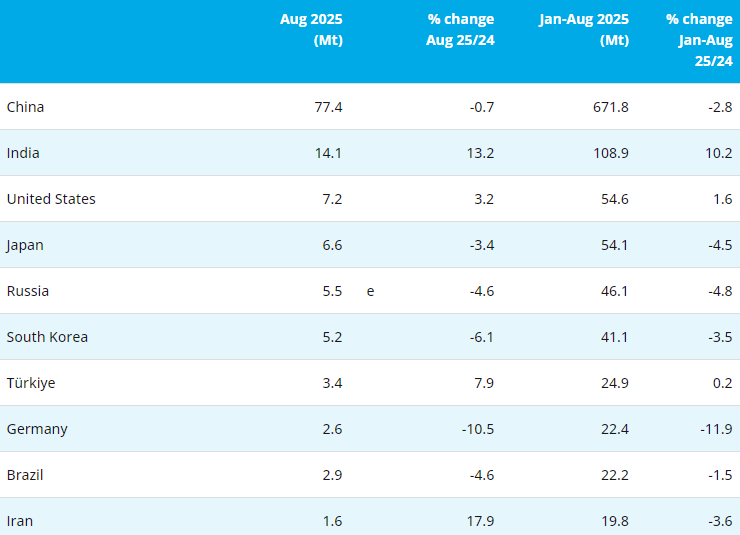
According to the statistical data of Trade Statistics of Japan, from January to November 2022, Japan imported 384475.099 tons of ferrosilicon (containing by weight more than 55% of silicon), an increase of 2426.495 tons or 0.64% over the same period last year. Among them, 113221.603 tons were imported from China, accounting for 29.45%.
| COUNTRY/AREA | CURRENT MONTH QUANTITY (TON) | CURRENT MONTH VALUE (1000YEN) | CUMULATIVE YEAR TO DATE QUANTITY (TON) | CUMULATIVE YEAR TO DATE VALUE (1000YEN) |
| CHINA | 8981.78 | 2264626 | 113221.603 | 31475635 |
| RUSSIA | 5195.531 | 1278021 | 99257.044 | 27429907 |
| MALYSIA | 4929.188 | 1218154 | 71128.367 | 21182906 |
| BRAZIL | 2843.7 | 1796944 | 58951.9 | 23265091 |
| ICELAND | 1503.8 | 913086 | 23553.9 | 11006786 |
| KAZAKHS | 105.265 | 28398 | 7627.202 | 2481018 |
| NORWAY | 249.6 | 157848 | 5359.65 | 1960526 |
| VIETNAM | 279 | 80087 | 2701.276 | 775863 |
| FRANCE | 243 | 140503 | 2025.16 | 790981 |
| KUWAIT | - | - | 266.724 | 75596 |
| THAILND | 33 | 11222 | 229 | 76087 |
| TAIWAN, CHINA | - | - | 108.176 | 27486 |
| R KOREA | - | - | 17.285 | 8244 |
| INDIA | - | - | 17 | 7208 |
| GERMANY | 0.31 | 327 | 9.694 | 8534 |
| CANADA | - | - | 0.6 | 453 |
| U KING | - | - | 0.518 | 558 |
| TOTAL | 24364.174 | 7889216 | 384475.099 | 120572879 |
Copyright © 2013 Ferro-Alloys.Com. All Rights Reserved. Without permission, any unit and individual shall not copy or reprint!
- [Editor:kangmingfei]


 Save
Save Print
Print Daily News
 Research
 Magazine
 Company Database
 Customized Database
 Conferences
 Advertisement
 Trade
Trade


 Online inquiry
 Contact

Tell Us What You Think