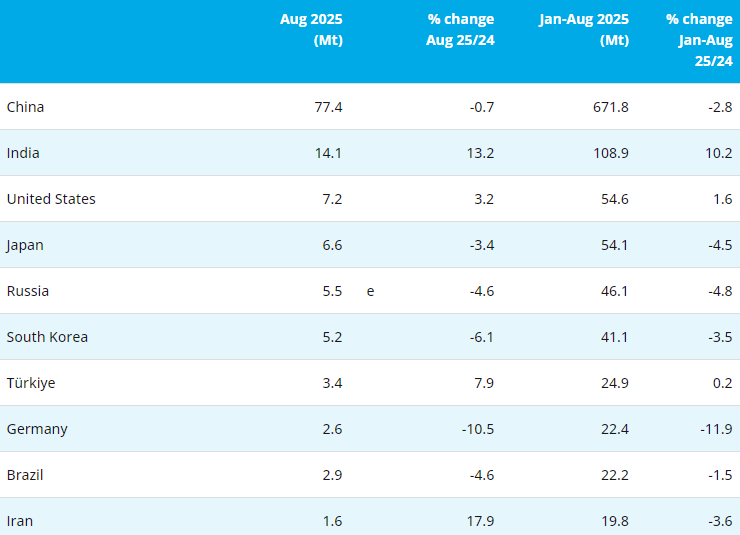
According to data of China Customs, in January 2022, China exported 68504.796 tons of ferrosilicon (containing by weight more than 55% of silicon), an increase of 233.71% year-on-year and 15.15% month on month.
Among them, 16495.421 tons were exported to Indonesia, accounting for 24.08%; 13715.1 tons were exported to South Korea, accounting for 20.02%.
| Parters | Quantity (tons) | Quantity Proportion | US dollars |
| Indonesia | 16495.421 | 24.08% | 32,436,617 |
| Korea | 13715.1 | 20.02% | 29,485,310 |
| India | 7676.6 | 11.21% | 9,265,785 |
| Japan | 6223.041 | 9.08% | 13,744,227 |
| Taiwan, China | 4783.384 | 6.98% | 9,599,055 |
| Vietnam | 3177.237 | 4.64% | 5,747,530 |
| Malaysia | 2218.733 | 3.24% | 4,004,426 |
| Thailand | 2136 | 3.12% | 3,361,585 |
| Chile | 1773.61 | 2.59% | 3,868,169 |
| Turkey | 1441.8 | 2.10% | 2,291,607 |
| Mexico | 1389 | 2.03% | 2,775,295 |
| Brazil | 1148 | 1.68% | 2,080,765 |
| The Netherlands | 1020.87 | 1.49% | 2,023,465 |
| America | 938 | 1.37% | 1,655,120 |
| UAE | 728 | 1.06% | 1,238,080 |
| Oman | 404 | 0.59% | 691,460 |
| Peru | 395 | 0.58% | 721,849 |
| South Africa | 289 | 0.42% | 549,019 |
| Finland | 243 | 0.35% | 468,585 |
| Greece | 200 | 0.29% | 293,050 |
| Russian Federation | 187 | 0.27% | 131,087 |
| Ukraine | 164 | 0.24% | 178,644 |
| Colombia | 164 | 0.24% | 310,127 |
| Australia | 160 | 0.23% | 329,200 |
| Venezuela | 150 | 0.22% | 240,000 |
| Ecuador | 135 | 0.20% | 269,595 |
| Canada | 130 | 0.19% | 287,820 |
| Singapore | 125 | 0.18% | 202,625 |
| Ghana | 108 | 0.16% | 184,140 |
| Bahrain | 103 | 0.15% | 200,590 |
| Spain | 100 | 0.15% | 178,000 |
| Georgia | 100 | 0.15% | 70,100 |
| Myanmar | 98 | 0.14% | 116,660 |
| Egypt | 75 | 0.11% | 146,574 |
| Pakistan | 56 | 0.08% | 41,214 |
| Morocco | 54 | 0.08% | 109,812 |
| Croatia | 50 | 0.07% | 81,000 |
| Jordan | 48 | 0.07% | 80,640 |
| Argentina | 27 | 0.04% | 47,520 |
| Saudi Arabia | 25 | 0.04% | 43,750 |
| Britain | 25 | 0.04% | 55,680 |
| Guatemala | 25 | 0.04% | 43,375 |
| Total | 68504.796 | 100.00% | 129,649,152 |
Copyright © 2013 Ferro-Alloys.Com. All Rights Reserved. Without permission, any unit and individual shall not copy or reprint!
- [Editor:kangmingfei]


 Save
Save Print
Print Daily News
 Research
 Magazine
 Company Database
 Customized Database
 Conferences
 Advertisement
 Trade
Trade


Tell Us What You Think