

 Save
Save Print
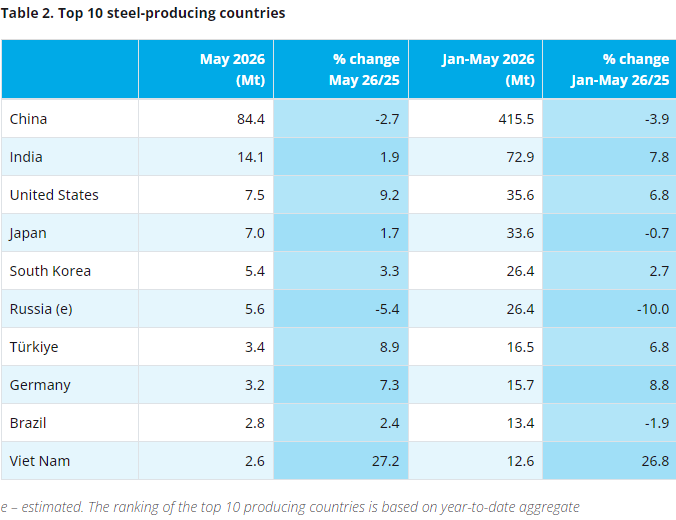
PrintSeasonally adjusted index of the volume of mining production for the latest three months by mineral group and mineral (Base: 2015=100)
|
Mineral group and mineral |
Weight |
Jun – Aug 2020 |
Sep – Nov 2020 |
% change between Jun – Aug 2020 and Sep – Nov 2020 |
Contribution (% points) to the % change in total mining production |
|
Gold |
16,81 |
63,4 |
71,8 |
13,2 |
1,6 |
|
Iron ore |
10,76 |
74,5 |
72,7 |
-2,4 |
-0,2 |
|
Chromium ore |
3,93 |
78,3 |
94,2 |
20,3 |
0,7 |
|
Mineral group and mineral |
Weight |
Jun-20 |
Jul-20 |
Aug-20 |
Sep-20 |
Oct-20 |
Nov-20 |
|
Gold |
16,81 |
63,9 |
68,8 |
70,0 |
81,6 |
79,8 |
75,9 |
|
Iron ore |
10,76 |
80,7 |
80,5 |
76,3 |
75,3 |
70,7 |
69,4 |
|
Chromium ore |
3,93 |
69,0 |
78,1 |
96,6 |
106,7 |
93,8 |
100,4 |
Seasonally adjusted index of the volume of mining production by mineral group and mineral (Base: 2015=100)
|
Mineral group and mineral |
Jun-20 |
Jul-20 |
Aug-20 |
Sep-20 |
Oct-20 |
Nov-20 |
Month-on- month % change |
|
Gold |
58,6 |
65,5 |
66,0 |
72,5 |
72,1 |
70,9 |
-1,7 |
|
Iron ore |
68,1 |
79,4 |
76,1 |
73,1 |
73,8 |
71,2 |
-3,5 |
|
Chromium ore |
65,4 |
77,0 |
92,4 |
102,7 |
85,3 |
94,7 |
11,0 |
Year-on-year percentage change in the volume of mining production by mineral group and mineral
|
Mineral group and mineral |
Jun-20 |
Jul-20 |
Aug-20 |
Sep-20 |
Oct-20 |
Nov-20 |
|
Gold |
-16,3 |
-9,0 |
-14,3 |
-1,1 |
-4,0 |
-7,0 |
|
Iron ore |
-33,9 |
-18,3 |
-19,8 |
-31,5 |
-27,6 |
-35,3 |
|
Chromium ore |
-42,8 |
-33,0 |
-18,0 |
-6,8 |
-24,8 |
-17,9 |
Contribution of each mineral group and mineral to the year-on-year percentage change in the volume of mining production (percentage points)
|
Mineral group and mineral |
Jun-20 |
Jul-20 |
Aug-20 |
Sep-20 |
Oct-20 |
Nov-20 |
|
Gold |
-1,9 |
-1,1 |
-1,9 |
-0,1 |
-0,5 |
-0,9 |
|
Iron ore |
-4,1 |
-1,9 |
-1,9 |
-3,6 |
-2,7 |
-3,9 |
|
Chromium ore |
-1,9 |
-1,5 |
-0,8 |
-0,3 |
-1,1 |
-0,8 |
Mineral sales at current prices by mineral group and mineral (R million)
|
Mineral group and mineral |
Jun-20 |
Jul-20 |
Aug-20 |
Sep-20 |
Oct-20 |
Nov-20 |
|
Gold |
3 222,2 |
8 898,0 |
7 999,9 |
6 448,3 |
12 459,8 |
6 873,1 |
|
Iron ore |
5 978,7 |
6 792,1 |
8 417,9 |
9 571,2 |
5 866,1 |
7 770,7 |
|
Chromium ore |
1 635,7 |
1 614,1 |
1 629,7 |
1 910,0 |
2 084,9 |
1 821,2 |
Year-on-year percentage change in mineral sales at current prices by mineral group and mineral
|
Mineral group and mineral |
Jun-20 |
Jul-20 |
Aug-20 |
Sep-20 |
Oct-20 |
Nov-20 |
|
Gold |
-45,0 |
12,8 |
7,6 |
-16,4 |
65,0 |
-14,2 |
|
Iron ore |
-2,8 |
-3,0 |
37,4 |
85,3 |
28,7 |
28,8 |
|
Chromium ore |
-20,6 |
-5,0 |
-7,2 |
-10,9 |
5,0 |
-7,1 |
Contribution of each mineral group and mineral to the year-on-year percentage change in mineral sales at current prices (percentage points)
|
Mineral group and mineral |
Jun-20 |
Jul-20 |
Aug-20 |
Sep-20 |
Oct-20 |
Nov-20 |
|
Gold |
-5,5 |
2,3 |
1,2 |
-2,5 |
9,8 |
-2,3 |
|
Iron ore |
-0,4 |
-0,5 |
4,9 |
8,8 |
2,6 |
3,5 |
|
Chromium ore |
-0,9 |
-0,2 |
-0,3 |
-0,5 |
0,2 |
-0,3 |
- [Editor:Catherine Ren]
 Daily News
 Research
 Magazine
 Company Database
 Customized Database
 Conferences
 Advertisement
 Trade
Trade


 Online inquiry
 Contact


Tell Us What You Think