

 Save
Save Print
Print

The 22nd China Ferro-alloys International Conference, host ed by Ferro-Alloys.com, will be held on 20 May to 22 May, 2026 in Beijing city, China. We sincerely invite you jointly explore the development ferroalloys trend in 2026. Why Attend?
[Ferro-Alloys.com]
JMS Manganese Ore Activities Report in Q3 FY2026
Q3 FY2026 Quarterly Activities Report: Summary
The March 2026 quarter saw continuing strong operational performance in line with expectations. Sales and production were flat quarter-on-quarter (QoQ) and in line with full year targets.
EBITDA was up strongly QoQ (by 49%) due to manganese prices. Cash was down 6%, but only due to the payment of an interim dividend (operating cashflow was up 27% QoQ).
Unit costs increased (to US$2.50 per dmtu) due to the South African Rand (ZAR) strengthening against the US dollar (USD). The cost per unit for this quarter would be US$2.21 per dmtu, for example, if calculated at the March 2025 quarter ZAR/USD rate.
The March 2026 quarter saw average (realised) manganese prices increase on the December 2025 quarter average (US$4.35/dmtu CIF, from US$4.10/dmtu CIF). The spot price at 31 March 2026 was US$5.16/dmtu (CIF). At the end of April 2026 the spot price is US$5.13/dmtu (CIF), 0.6% lower than the price seen at the end of the March 2026 quarter.
Freight rates increased to US$36.90 per tonne, at the end of the March 2026 quarter (Port Elizabeth to Tianjin) compared with US$25.00 per tonne at the start of the March 2026 quarter (48% increase). By the end of April 2026, freight rates have reduced to US$32.10 per tonne.
The impact of the war in the Middle East on energy markets increased the cost of diesel and freight during the quarter. Manganese prices increased sufficiently to compensate for these cost increases. Tshipi has planned diesel inventory on site and continues to receive deliveries of diesel in line with long term agreements. Tshipi will continue to monitor energy supply risks but does not foresee any risk to operational continuity at this stage.
Tshipi Manganese Mine
Key production, sales and financial information for Tshipi for the quarter ended 31 March 2026, and comparatives, are presented below:
|
Key Statistic |
Unit |
Q3 FY2026 |
Q2 FY2026 |
Q1 FY2026 |
YTD FY2026 |
Q3 FY2025 |
|
Production |
Tonnes |
849,772 |
840,688 |
829,798 |
2,520,258 |
858,152 |
|
Sales |
Tonnes |
839,989 |
867,619 |
837,577 |
2,545,185 |
777,229 |
|
Average CIF price achieved (HGL) |
US$/dmtu |
4.35 |
4.10 |
3.86 |
4.07 |
4.03 |
|
Average FOB price achieved (HGL)1 |
US$/dmtu |
3.66 |
3.36 |
3.18 |
3.40 |
3.42 |
|
Average FOB cost of production |
US$/dmtu |
2.50 |
2.24 |
2.27 |
2.33 |
2.06 |
|
Earnings before interest, tax and depreciation (EBITDA) |
A$ million |
32.2 |
21.6 |
26.6 |
80.4 |
44.3 |
|
Net profit after tax (NPAT) |
A$ million |
21.0 |
14.6 |
17.8 |
53.4 |
28.3 |
|
Cash at bank |
A$ million |
129.2 |
137.4 |
140.3 |
129.2 |
130.5 |
MINING AND PRODUCTION
|
|
Uni |
Q3 FY2026 |
Q2 FY2026 |
Q1 FY2026 |
YTD FY2026 |
Q3 FY2025 |
|
Mined volume |
||||||
|
bcm |
2,381,449 |
2,769,372 |
3,139,687 |
8,290,508 |
3,290,517 |
|
bcm |
216,231 |
189,922 |
199,769 |
605,922 |
235,076 |
|
Total |
|
2,597,680 |
2,959,294 |
3,339,456 |
8,896,430 |
3,525,593 |
|
Production |
|
|
|
|
|
|
|
Tonnes |
707,355 |
722,609 |
654,494 |
2,084,458 |
858,152 |
|
Tonnes |
142,417 |
118,079 |
175,304 |
435,800 |
- |
|
Total |
|
849,772 |
840,688 |
829,798 |
2,520,258 |
858,152 |
|
Average FOB cost of production (HGL) |
US$/dmtu |
2.50 |
2.24 |
2.27 |
2.33 |
2.06 |
Mining of graded ore increased by 14% due to increased barrier pillar mining, while waste mining volumes decreased by 14% from the previous quarter, mainly due to seasonal rain and equipment availability.
Tshipi high-grade ore production decreased by 2%. Low-grade ore production increased by 21% but was ceased in March 2026 to maximise the benefit of positive market conditions.
Cost of production increased 12% to US$2.50 per dmtu on an FOB basis for the quarter. The increase was driven by a strengthening PCP exchange rate, recalculated cost of production would have been US$2.21 per dmtu).
LOGISTICS AND SALES
|
|
Unit |
Q3 FY2026 |
Q2 FY2026 |
Q1 FY2026 |
YTD FY2026 |
Q3 FY2025 |
|
On-land logistics |
Tonnes |
869,977 |
857,284 |
868,442 |
2,595,703 |
885,997 |
|
Sales |
|
|
|
|
|
|
|
Tonnes |
657,234 |
744,449 |
652,317 |
2,054,000 |
599,102 |
|
Tonnes |
182,755 |
123,170 |
185,260 |
491,185 |
178,127 |
|
Tonnes |
- |
- |
- |
- |
- |
|
Total |
|
839,989 |
867,619 |
837,577 |
2,545,185 |
777,229 |
|
Average CIF price achieved (HGL) |
US$/dmtu |
4.35 |
4.10 |
3.86 |
4.07 |
4.03 |
|
Average FOB price achieved (HGL) |
US$/dmtu |
3.66 |
3.36 |
3.18 |
3.40 |
3.42 |
Logistics volumes increased by 1% for the quarter. South African road haulage was not utilised during the quarter (excluding the road portion of the Lüderitz channel).
Sales volumes slightly decreased in the quarter by 3% but remain on target for the full financial year plan.
OPERATIONS AND THE CURRENT MIDDLE EAST CONFLICT
The Tshipi mine is well placed to minimise any operational impact of the current conflict in the Middle East.
Tshipi has long-term agreements with diesel suppliers and a tank farm on site which can store almost one million litres of diesel. Tshipi currently has an average of 13 days’ consumption of diesel on site and continues to receive daily deliveries.
Tshipi will continue to monitor the situation but does not foresee any operational continuity risks at this stage.
As noted elsewhere in this report, the cost of diesel and shipping have both increased since the commencement of the conflict. To date, manganese prices have increased sufficient to compensate for these cost increases.
CORPORATE AND FINANCIAL
Tshipi recorded an EBITDA of A$32.2 million and NPAT of A$21.0 million for the quarter, an increase on the previous quarter (A$21.6 million and A$14.6 million, respectively). The increase was mainly due to the increase in manganese prices.
The South African Rand strengthened against the US Dollar (4%) and weakened against the Australian Dollar (1%), from the end of Q2 FY2026 to the end of Q3 FY2026. The US Dollar depreciation continued to be driven by weaker overall US Dollar conditions, firm commodity prices and improved domestic sentiment. In contrast, the slight weakening of the Rand against the Australian Dollar during the quarter reflected Australian Dollar resilience linked to global growth and commodity sentiment.
The Rand is expected to remain broadly supported but trade in a closer range rather than extend the rallies seen at the end of CY2025, with global risk sentiment continuing to be the key driver.
Marketing and Market Outlook
JUPITER MARKETING
Sales and financial information for Jupiter’s marketing entity for the quarter ended 31 March 2026, as well as comparatives, are presented below.
The prices shown below relate to the prices realised by Jupiter’s marketing team for the 49.9% share of Tshipi sales that are marketed by Jupiter.
MARKET COMMENTARY AND OUTLOOK
|
|
Unit |
Q3 FY2026 |
Q2 FY2026 |
Q1 FY2026 |
YTD FY2026 |
Q3 FY2025 |
|
Sales |
Tonnes |
428,643 |
450,596 |
416,581 |
1,295,820 |
379,409 |
|
Average CIF price achieved (HGL) |
US$/dmtu |
4.24 |
4.07 |
3.91 |
4.09 |
4.14 |
|
Average FOB price achieved (HGL)2 |
US$/dmtu |
3.71 |
3.33 |
3.21 |
3.47 |
3.55 |
|
Marketing fee income |
A$ million |
2.2 |
2.3 |
2.0 |
6.5 |
2.3 |
|
EBITDA |
A$ million |
2.2 |
2.0 |
1.9 |
6.1 |
2.1 |
|
NPAT |
A$ million |
1.7 |
1.4 |
1.3 |
4.4 |
1.5 |
|
Cash at bank |
A$ million |
2.7 |
4.5 |
3.0 |
2.7 |
2.4 |
MARKET COMMENTARY AND OUTLOOK
Manganese ore prices showed an increasing trend through the quarter, improving more dramatically towards the end of the quarter, driven predominantly by intensified conflict in the Middle East and an associated surge in global energy prices.
The Fastmarkets manganese ore semi carbonate index (36.5% Mn, CIF Tianjin) increased from US$4.15/dmtu on 29 December 2025 (corresponding FOB index: US$3.46/dmtu) to US$5.16/dmtu on 27 March 2026 (corresponding FOB index: US$4.14/dmtu).
Manganese ore prices were initially supported at the beginning of the quarter by seasonal restocking patterns prior to the Chinese Spring Festival, rising costs of arrival material, alongside exchange rate fluctuations.
The strengthening of the South African Rand against the US Dollar in the first half of the quarter presented the potential for a negative impact to margins for South African producers, resulting in higher US Dollar denominated seaborne quotations by producers. Simultaneously, the strengthening Chinese Yuan against the US Dollar supported the acceptance of the higher US Dollar denominated quotations by buyers in the region.
Manganese ore prices subsequently rose due to increased oil prices which drove up mining costs and more notably logistics costs (particularly ocean freight rates). The freight rate from Port Elizabeth to Tianjin, as referenced weekly by Fastmarkets, was quoted at US$36.90/tonne on 27 March 2026 compared to US$27.20/tonne on 27 February 2026 (pre-intense Middle East conflict).
The intensity of the conflict across the Middle East region also initially spurred supply chain risks with concerns surrounding manganese ore supply cuts. These concerns initially translated into increased buying appetite; however, this has subsequently started to moderate as manganese ore trade flows continue at normal levels, and port inventories in China remain well covered.
Manganese ore portside stocks at major ports in China saw an increasing trend through the quarter quoting stocks at 5.0 million tonnes at quarter end, still materially below long-term historical levels. The increase in port stocks of circa 0.6 million tonnes since the beginning of the quarter was predominantly driven by lower manganese alloy production in China compared to the preceding quarter.
Spot silico manganese prices were range bound for most of the quarter, before increasing towards the end of the quarter due to rising input costs. Silico manganese prices did not, however, rise sufficiently to cover the extent of the rise in manganese ore prices due to subdued downstream demand from the steel sector. During the recent period of rising ore prices, alloy plants were typically replenishing ore to cover immediate needs, rather than actively purchasing forward cover. Expectations of alloy production cuts post quarter end also temporarily supported alloy prices in late March; however, caution still prevails in a well-supplied market.
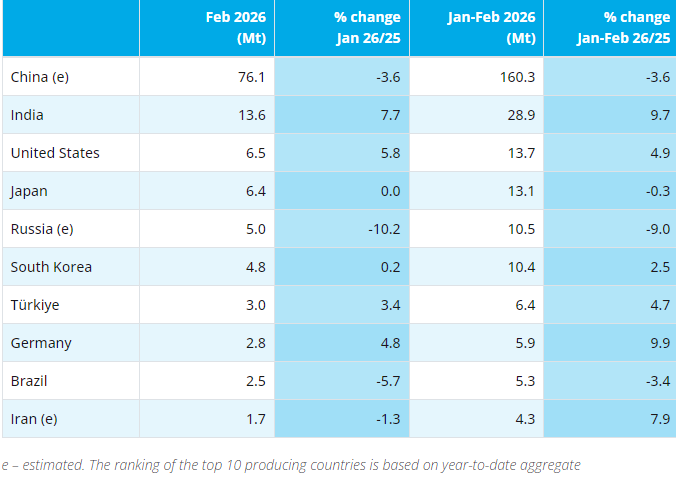
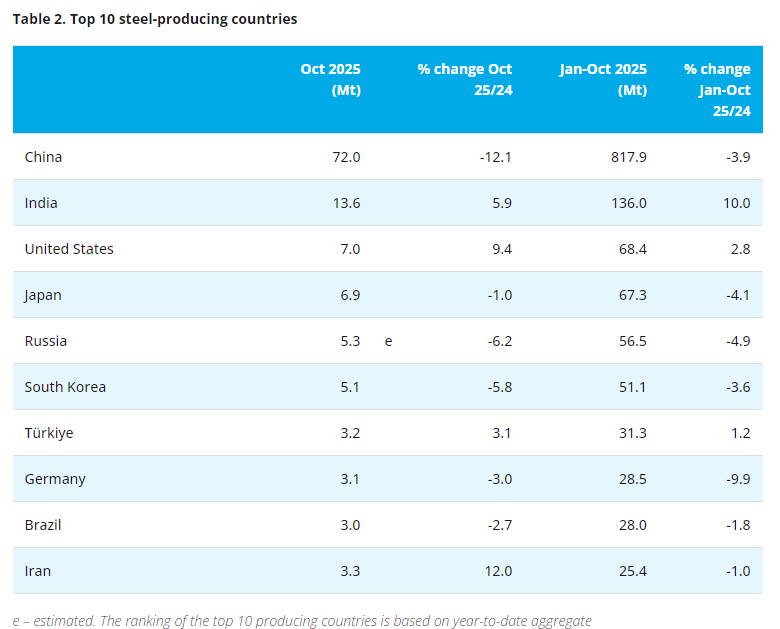
Further downstream, global crude steel production declined during the quarter on an annual comparative basis. On the contrary, crude
steel production showed strong growth from Q2 FY2026 on a global, China-only and rest of world basis.
China did however continue to face weak domestic demand through most of the quarter, and the continued slump in the real estate sector continues to provide headwinds despite the buoyant export and manufacturing related sectors. Elevated levels of inventories at steel mills pose further downside risk however with a broadly stable forecast GDP for 2026 in the country, the Worldsteel Association has only forecast a decline in crude steel demand of 1.5% in 2026 (Short Range Outlook: April 2026).
The Worldsteel Association forecasts global steel demand growth in 2026 of 0.3% (Short Range Outlook: April 2026), assuming a resolution to the Middle East conflict by June.
Post quarter end, lingering geopolitical tensions in the Middle East continue to influence manganese ore price movements. Whilst oil prices have moderated from the high levels seen in March, volatility persists. This volatility, feeding into ocean freight rates and diesel costs, is expected to continue to influence manganese ore price movements in the short term.
|
Key market prices |
Unit |
Today (end Apr 2026) |
% change 31 Mar 2026 |
31 Mar 2026 |
31 Dec 2025 |
30 Sep 2025 |
30 Jun 2025 |
31 Mar 2025 |
|
Mn ore 37% FOB Port Elizabeth |
US$/dmtu |
4.25 |
2.7% |
4.14 |
3.46 |
3.36 |
3.20 |
3.62 |
|
Freight rate Port Elizabeth to Tianjin (estimate) |
US$/dmtu |
32.10 |
(13.0%) |
36.90 |
25.00 |
24.70 |
22.96 |
23.70 |
|
Total stock at Chinese ports |
‘000 tonnes |
4,927 |
(1.7%) |
5,013 |
4,411 |
4,397 |
4,300 |
3,600 |
- [Editor:tianyawei]
 Daily News
 Research
 Magazine
 Company Database
 Customized Database
 Conferences
 Advertisement
 Trade
Trade


 Online inquiry
 Contact


Tell Us What You Think