

 Save
Save Print
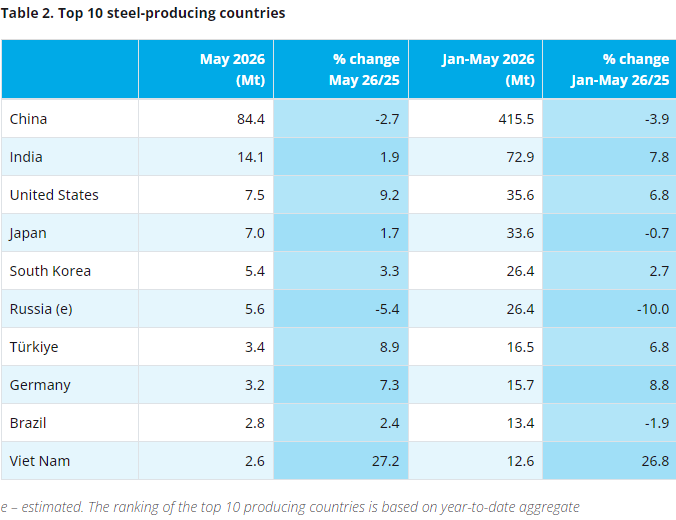
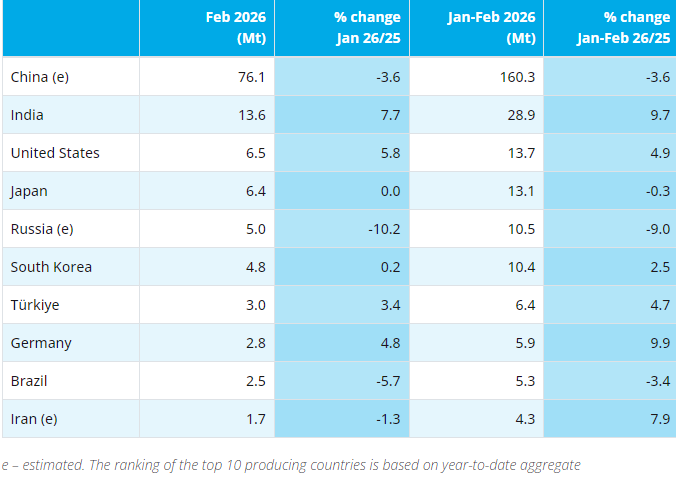
Print[Ferro-Alloys.com] The World Steel Association (worldsteel) has published the 2019 edition of World Steel in Figures. The publication provides a comprehensive overview of steel industry activities, stretching from crude steel production to apparent steel use, from indications of global steel trade flows to iron ore production and trade.
.png)
| Apparent Steel Use (Consumption) Per Capita 2018 (Kilograms) | |||||
| Countries/Areas | Consumption | Countries/Areas | Consumption | Countries/Areas | Consumption |
| South Korea | 1047.2 | Poland | 390.9 | Mexico | 194.4 |
| Taiwan, China | 753.5 | Belgium-Luxbrg | 383.3 | Oceania | 170.9 |
| Czech Rep | 703 | Turkey | 373.4 | United Kingdom | 162.3 |
| China | 590.1 | Spain | 308.5 | Egypt | 111.4 |
| Japan | 514.1 | USA | 306.5 | Argentina | 108 |
| Germany | 495.5 | Russia | 285.9 | Ukraine | 105.6 |
| Austria | 474.1 | Netherlands | 272.2 | Brazil | 100 |
| Canada | 469 | Iran | 238.5 | South Africa | 81.3 |
| Italy | 445 | Romania | 235 | India | 70.9 |
| Sweden | 409.1 | France | 215.9 | Venezuela | 5.3 |
(worldsteelassociation)


Copyright © 2013 Ferro-Alloys.Com. All Rights Reserved. Without permission, any unit and individual shall not copy or reprint!
- [Editor:kangmingfei]
 Daily News
 Research
 Magazine
 Company Database
 Customized Database
 Conferences
 Advertisement
 Trade
Trade


.jpg)

 Online inquiry
 Contact


Tell Us What You Think